Pattern Recognizer
Recognize and highlight popular chart patterns and associated Points of Interest for a trade entry. Monitor sequential pattern occurrences and connect the indicator to your strategy for fully automated trade execution.
Log into your account and get a free 14-day trail from our download page.
Pattern Highlighting
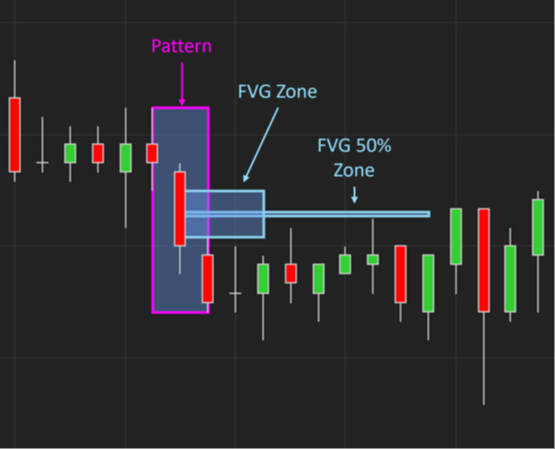
The Pattern Recognizer can highlight the chart sector where the related pattern occurred for easy validation.
Zones of Interest
Once a pattern has occurred usually Zones of interest are formed from which an entry is typically considered. Pattern Recognizer can highlight one or multiple Zones per pattern.

Accessible Trade Signals
Once price retraces back to a Zone of interest a signal is produced in the form of a Plot, which can easily be accessed from your NinjaTrader Strategy and used as an entry signal.
14+ Patterns to Automate your favourite trading approaches.
Check below for a comprehensive list of supported patterns.
Supported Patterns
The following patterns are typically explained in a bullish scenario, but are available separately for both directions. If a signal is required in both directions, the indicator can be added multiple times to a chart.
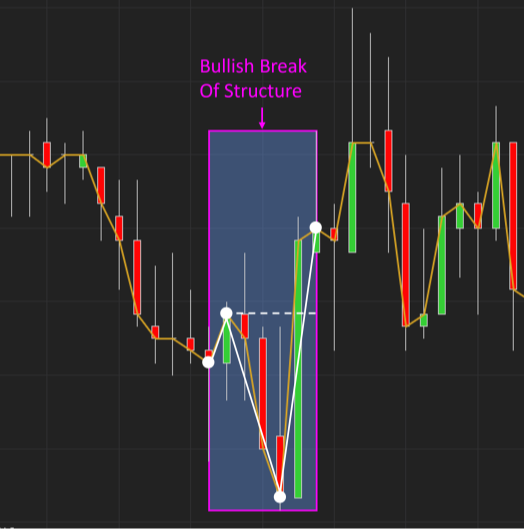
The Break of Structure is a classic reversal indication. Price forms a "Break of Structure" or BOS when price fails to maintain the prevailing trend and instead breaks the prevailing trend structure of Higher-Highs and Higher-Lows. It does so by creating a sequence as follows:
Bullish (at the end of a down-trend):
Bullish Break of Structure Event Sequence
Lower-Low | Lower-High | Lower-Low | Higher-High
Bearish Break of Structure Event Sequence
Higher-High | Higher-Low | Higher-High | Lower-Low
The term Fair Value Gap was coined (to our best knowledge) by The Inner Circle Trader (ICT). It represents one type of volume imbalance where the market was unable to permit proper trade-execution on the long and short side and hence is expected to revisit the area and "Fill the Gap". A plain fair value gap on a bullish run happens when the low of the last candle is higher than the high of the third-last candle.
The term Liquidity Pool describes a collection of stop orders that are placed by typically retail traders in common places such as stop loss order just above the last swing high. The SiT Pattern Recognizer assumes liquidity above every medium high and below every medium low.
"Medium Swing High"
A Higher-High that has a Lower-High to its right.
Known under many different names we look for two consecutive up-candles, each with a large body and the Close of the first candle being almost equal to the Open of the second (i.e. last) candle (hence the reference to "Kissing"). The term Hidden Base was coined by The Inner Circle Trader and refers to the area between the High of the first bar and the Low of the last bar.
Used regularly in Malaysian Support and Resistance (SNR) Style trading support is defined here as a down candle, followed by an up candle. The actual support zone is typically the lower value between the Close of the first bar and the Open of the second.
As the name suggests this pattern is often sought to mark the start of a significant move and occurs when the body of the last candle extends beyond the body of the candle prior.
Release Notes
Please log in and visit our Downloads page for detailed release notes of our Pattern Recognizer solution.